Multiple Choice
Refer to the graph in Infographic 3.What does the figure show? 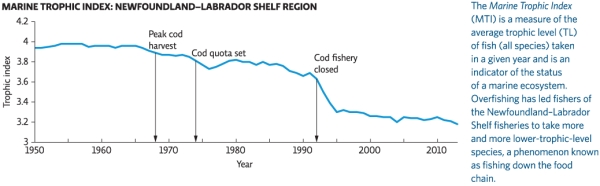
A) fish catch in the 1960s containing mostly lower-trophic-level fish,suggesting that higher-trophic-level fish populations had been depleted
B) the size of fish catch that could be harvested in any given year without decreasing the yield in future years
C) the decrease in the size of the bycatch of different trophic levels over time as fishing technology improved
D) a plot of the Marine Trophic Index from 1950 to 2006,which is a measure of the average trophic level of fish taken in a given year and which is an indicator of the status of a marine ecosystem
E) the annual size of the cod harvest from 1950 to 2006
Correct Answer:

Verified
Correct Answer:
Verified
Q53: The difference between a marine-protected area and
Q54: Which statement about fish is FALSE?<br>A)In poorer
Q55: The Magnuson-Stevens Fishery Conservation and Management Act
Q56: Recirculating aquaculture systems (RAS)are best suited in
Q57: A fishery with annual catches below 10%
Q59: _ are discrete regions of ocean that
Q60: How can recirculating aquaculture systems (RAS)address the
Q61: As a marine biologist,you notice that the
Q62: Which statement about aquaculture is TRUE?<br>A)Despite technological
Q63: The Marine Stewardship Council defines a sustainable