Multiple Choice
Exhibit 1-16 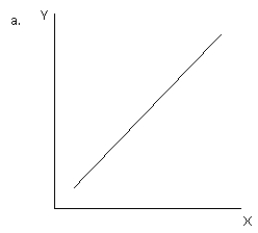
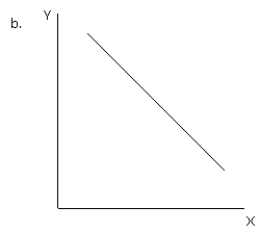
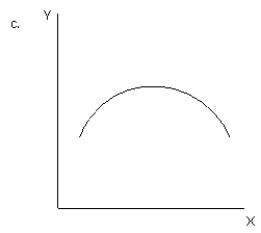
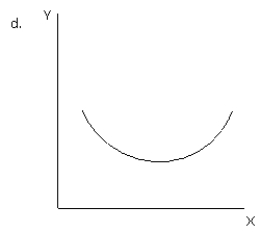
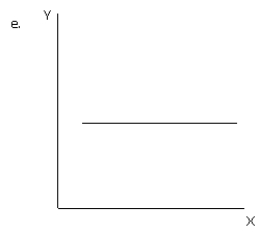
-Refer to exhibit 1-16.Which of the graphs illustrates an inverse or negative relationship between variable X and variable Y?
A) a
B) b
C) c
D) d
E) e
Correct Answer:

Verified
Correct Answer:
Verified
Q8: Any point on a graph represents a
Q9: The slope of an inverted U-shaped curve
Q15: Suppose the cost of producing copper tubing
Q36: The slope of a line<br>A)can only be
Q49: Exhibit 1-5 <img src="https://d2lvgg3v3hfg70.cloudfront.net/TB4914/.jpg" alt="Exhibit 1-5
Q51: Exhibit 1-15 <img src="https://d2lvgg3v3hfg70.cloudfront.net/TB4914/.jpg" alt="Exhibit 1-15
Q53: Exhibit 1-6 <img src="https://d2lvgg3v3hfg70.cloudfront.net/TB4914/.jpg" alt="Exhibit 1-6
Q54: Exhibit 1-2 <img src="https://d2lvgg3v3hfg70.cloudfront.net/TB4914/.jpg" alt="Exhibit 1-2
Q56: Exhibit 1-8 <img src="https://d2lvgg3v3hfg70.cloudfront.net/TB4914/.jpg" alt="Exhibit 1-8
Q67: The numerical value of the slope of