Multiple Choice
Exhibit 11-4 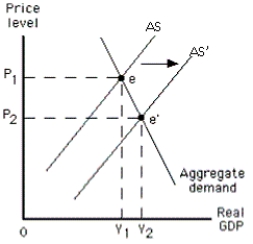
-The graph in Exhibit 11-4 shows a(n)
A) increase in short-run aggregate supply
B) increase in long-run aggregate supply
C) decrease in short-run aggregate supply
D) decrease in long-run aggregate supply
E) decrease in aggregate quantity demanded
Correct Answer:

Verified
Correct Answer:
Verified
Q17: Suppose the economy is initially in long-run
Q32: Given the aggregate demand curve,a beneficial supply
Q64: In the long run,but not in the
Q110: The amount by which actual output falls
Q117: Increases in the costs of producing each
Q120: When the economy is at its potential
Q165: Suppose that the actual and expected price
Q184: If the inflation rate is 4 percent
Q195: If resource suppliers and demanders find out
Q205: Exhibit 11-2 <img src="https://d2lvgg3v3hfg70.cloudfront.net/TB4913/.jpg" alt="Exhibit 11-2