Multiple Choice
Exhibit 11-9 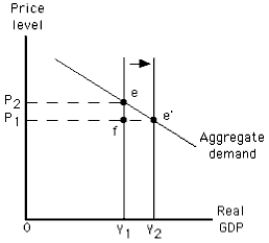
-The graph in Exhibit 11-9 shows a(n)
A) increase in short-run aggregate supply
B) increase in long-run aggregate supply
C) decrease in short-run aggregate supply
D) decrease in long-run aggregate supply
E) decrease in aggregate quantity demanded
Correct Answer:

Verified
Correct Answer:
Verified
Q8: A contractionary gap may be closed in
Q16: If wages are flexible,the long-run aggregate supply
Q67: CEO Carmen Ngouri must choose between laying
Q81: In the long run,a decrease in aggregate
Q81: At the potential level of output,there is
Q91: Given the aggregate demand curve,an adverse supply
Q177: Which of the following would shift the
Q184: Exhibit 11-10 <img src="https://d2lvgg3v3hfg70.cloudfront.net/TB4913/.jpg" alt="Exhibit 11-10
Q187: Throughout the 1990s,<br>A)unemployment rates were higher in
Q194: If the price level rises by 5