Multiple Choice
Exhibit 11-10 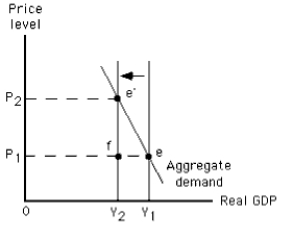
-The graph in Exhibit 11-10 shows a(n)
A) increase in long-run aggregate supply
B) increase in short-run aggregate supply
C) decrease in short-run aggregate supply
D) decrease in long-run aggregate supply
E) increase in aggregate quantity demanded
Correct Answer:

Verified
Correct Answer:
Verified
Q40: Exhibit 11-1<br> <img src="https://d2lvgg3v3hfg70.cloudfront.net/TB4913/.jpg" alt="Exhibit 11-1
Q43: Exhibit 11-6 <img src="https://d2lvgg3v3hfg70.cloudfront.net/TB4913/.jpg" alt="Exhibit 11-6
Q47: Exhibit 11-1<br> <img src="https://d2lvgg3v3hfg70.cloudfront.net/TB4913/.jpg" alt="Exhibit 11-1
Q48: Exhibit 11-9 <img src="https://d2lvgg3v3hfg70.cloudfront.net/TB4913/.jpg" alt="Exhibit 11-9
Q62: If the expected price level falls below
Q74: Which of the following would cause the
Q134: Increases in the costs of production will
Q153: Suppose firms are continually surprised by higher-than-expected
Q186: A rising price level in the short
Q210: Whether aggregate supply shifts quickly or slowly