Multiple Choice
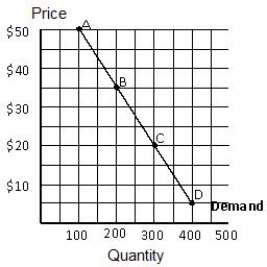
Figure 5.3 shows a linear demand curve. Between points B and C, the demand is:
Figure 5.3
A) unitary.
B) elastic.
C) inelastic.
D) perfectly elastic.
E) perfectly inelastic.
Correct Answer:

Verified
Correct Answer:
Verified
Related Questions
Q32: A normal good is defined as a
Q67: Unit-elastic demand occurs when:<br>A)a one-unit increase in
Q68: If Joe says that nothing comes close
Q122: A perfectly elastic demand curve is _<br>A)a
Q130: If an increase in the price of
Q142: One group of people uses New York
Q184: The value of the price elasticity of
Q202: If demand is price elastic, total revenue
Q240: Any supply curve that is a straight
Q242: If demand is elastic, a decrease in