Multiple Choice
Figure 5.6 shows a vertical demand curve. The demand in the figure below is:
Figure 5.6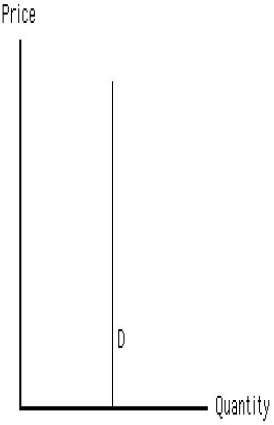
A) unit elastic.
B) relatively elastic.
C) perfectly elastic.
D) relatively inelastic.
E) perfectly inelastic.
Correct Answer:

Verified
Correct Answer:
Verified
Related Questions
Q9: One determinant of the price elasticity of
Q100: Figure 5.8 shows a horizontal line. The
Q102: The demand for Olin skis is likely
Q103: The cross-price elasticity of demand between pancakes
Q107: In order to prove that Coca Cola
Q108: Table 5.4 shows the price and quantity
Q109: For which of the following products is
Q126: The price elasticity of demand is useful
Q147: The supply of paintings by Van Gogh
Q151: Economists distinguish between normal and inferior goods