Multiple Choice
Figure 5.7 shows four demand curves. The demand curve that best illustrates how consumers will respond to a change in price over a very long time period is: Figure 5.7
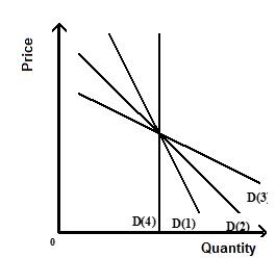
A) curve D(1) .
B) curve D(2) .
C) curve D(4) .
D) curve D(3) .
E) curve D(1) or curve D(4) .
Correct Answer:

Verified
Correct Answer:
Verified
Q2: Identify a statement that is true about
Q8: If an increase in the price of
Q10: A perfectly inelastic demand curve is _<br>A)a
Q59: Along a linear demand curve, as the
Q103: As price decreases along a linear demand
Q135: Table 5.6 shows the change in the
Q143: Given the availability of California oranges, the
Q144: If the cross-price elasticity of demand between
Q164: If income rises and the demand for
Q207: Another word for elasticity is<br>A)responsiveness<br>B)happiness<br>C)bonus<br>D)profit<br>E)surplus