Multiple Choice
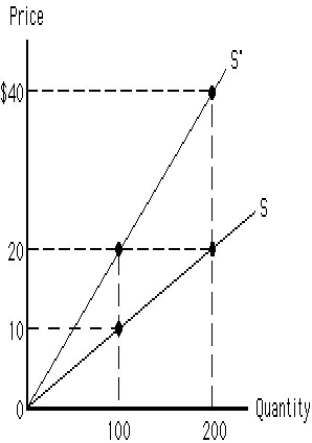
Figure 5.10 shows two upward-sloping linear supply curves that pass through the origin. The price elasticity of supply between $20 and $40 on the supply curve S' is _____. Figure 5.10
A) 0
B) infinity
C) 1
D) 2
E) 10
Correct Answer:

Verified
Correct Answer:
Verified
Related Questions
Q29: When the cross-price elasticity of demand between
Q40: As the economy recovers from a recession,we
Q61: If an increase in the price of
Q105: If the price elasticity of supply in
Q110: Table 5.6 shows the change in the
Q114: Which of the following is assumed to
Q116: Table 5.1 shows the change in the
Q119: The price elasticity of demand helps determine
Q177: The price elasticity of demand is defined
Q188: Demand for a necessity, such as food,