Multiple Choice
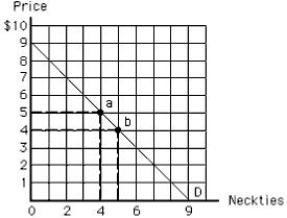
The following diagram shows Ken's demand curve for neckties. When the price of neckties is $5, Ken purchases four neckties. When the price of neckties falls to $4, he purchases five neckties. A decline in the price of neckties causes his expenditure to:
Figure 6.3
A) increase from $20 to $25, increasing his consumer surplus.
B) increase from $20 to $25, decreasing his consumer surplus.
C) remain constant at $20, leaving his consumer surplus unchanged.
D) remain constant at $20, increasing his consumer surplus.
E) decrease from $20 to $15, increasing his consumer surplus.
Correct Answer:

Verified
Correct Answer:
Verified
Q10: When total utility falls,marginal utility is _<br>A)at
Q22: The law of demand states that:<br>A)quantity demanded
Q25: Jerry consumes three hamburgers at McDonald's. He
Q26: The following table shows the total utility
Q28: Which of the following varies along the
Q52: The reason why Diana does not drink
Q78: The law of diminishing marginal utility states
Q118: If marginal utility is negative,total utility declines
Q149: Diminishing marginal utility means that _<br>A)as one
Q159: Differences in the opportunity cost of time