Multiple Choice
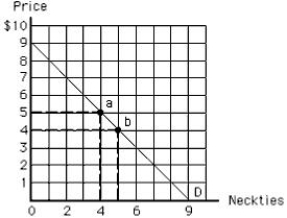
The following diagram shows Ken's demand curve for neckties. Point a on the curve shows that when the price of neckties is $5, Ken purchases four neckties. Point b on the curve shows that when the price of neckties falls to $4, he purchases five neckties. At point b, the dollar value of the total utility is valued at:
Figure 6.3
A) $30.
B) $26.
C) $20.
D) $35.
E) $25.
Correct Answer:

Verified
Correct Answer:
Verified
Q45: According to the utility theory, in "consumer
Q47: Suppose Hannah spends $3 to buy five
Q49: Sally wants to visit Orlando during the
Q51: The following table shows the marginal utility
Q52: The following table shows the total utility
Q54: If the amount paid for a good
Q77: The law of diminishing marginal utility states
Q99: Positive marginal utility implies increasing total utility.
Q129: A utility-maximizing consumer equalizes marginal utilities across
Q185: The fact that paper towels are available