Multiple Choice
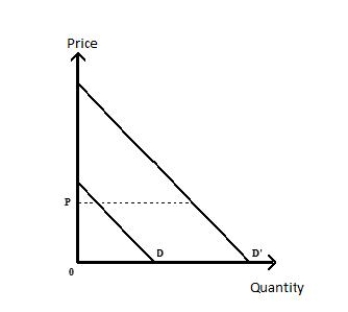
The following diagram shows Emily's demand curves for hot chocolate. On a normal day, Emily's demand curve for a cup of hot chocolate is shown as D. On a freezing day, her demand curve shifts rightward to D'. At a price P, Emily's consumer surplus on a freezing day:
Figure 6.8
A) cannot be determined without calculating her marginal valuation of a cup of hot chocolate.
B) increases significantly over her consumer surplus on a normal day.
C) will vary depending on whether hot chocolate is a normal or an inferior good.
D) increases only if her demand curve is unit-elastic.
E) decreases significantly over her consumer surplus on a normal day.
Correct Answer:

Verified
Correct Answer:
Verified
Q17: The marginal utility from an additional unit
Q22: The marginal utility of a second copy
Q65: Consumer preferences _<br>A)do not vary from one
Q81: Utility is _<br>A)the sense of pleasure or
Q86: In order to derive a demand curve
Q110: Which of the following people is least
Q111: If medical care is provided free of
Q117: Tyrell has $50 to spend on good
Q118: Demand for a service like medical care:<br>A)is
Q120: Suppose Enid could increase her total utility