Multiple Choice
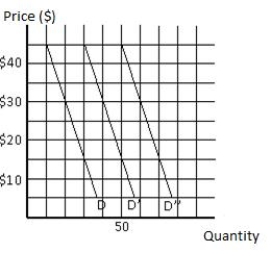
The following graph shows the demand curves for three consumers in the market, as represented by D, D' and D''. At a price of $45, the market quantity demanded for the good will be _____ units.
Figure 6.10
A) 50
B) 70
C) 90
D) 110
E) 130
Correct Answer:

Verified
Correct Answer:
Verified
Related Questions
Q38: Suppose the marginal utility of a unit
Q39: The following table shows the total utility
Q41: Suppose the marginal utility of a unit
Q42: As a consumer allocates income between good
Q45: According to the utility theory, in "consumer
Q47: Suppose Hannah spends $3 to buy five
Q77: The law of diminishing marginal utility states
Q99: Positive marginal utility implies increasing total utility.
Q103: Although some tastes do change over time,economists
Q116: The market demand curve is the sum