Multiple Choice
Consider the following figure that shows a competitive firm on the left panel and a competitive market on the right panel. The movement along the curve S from point E to E' in the right panel of the figure represents:
Figure 8.8
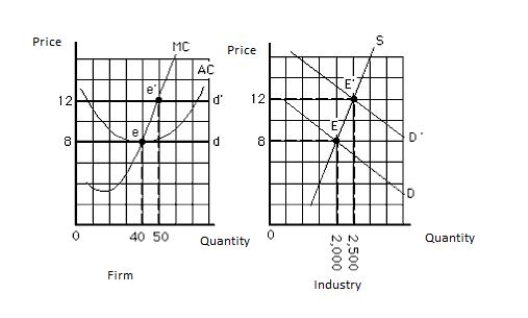
A) an increase in the number of firms in the industry.
B) an increase in output supplied by each firm in the industry.
C) both an increase in the number of firms in the industry and an increase in each firm's output.
D) an increase in the cost of production for the firms in the market.
E) an increase in total revenue of the representative firm from $8 to $12.
Correct Answer:

Verified
Correct Answer:
Verified
Q24: In the short run,producers derive surplus from
Q33: Suppose a perfectly competitive firm and industry
Q35: For a perfectly competitive firm, price is
Q36: For perfectly competitive firms, which of the
Q77: An industry consists of all firms that
Q159: Assume a perfectly competitive firm incurs a
Q166: The golden rule of profit maximization states
Q168: Suppose the market for hot pretzels in
Q170: The long-run market supply curve for an
Q179: After an increase in demand in a