Multiple Choice
Which of the curves shown in Figure 10.6 represents the long-run average cost curve for an oligopolist?
Figure 10.6
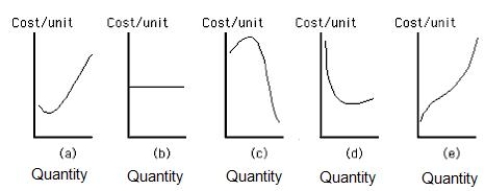
A) Curve a
B) Curve b
C) Curve c
D) Curve d
E) Curve e
Correct Answer:

Verified
Correct Answer:
Verified
Related Questions
Q15: The outcome in the prisoner's dilemma is
Q22: Due to the ease of entry of
Q23: Figure 10.4 shows the demand, marginal revenue,
Q41: Collusion among firms to raise prices is
Q63: If a firm in an industry achieves
Q70: Collusion is most likely to occur in
Q113: Monopolistically competitive firms ignore the effect of
Q123: A group of firms that agree to
Q127: As firms in an oligopoly are interdependent,they
Q138: If a monopolistically competitive firm is in