True/False
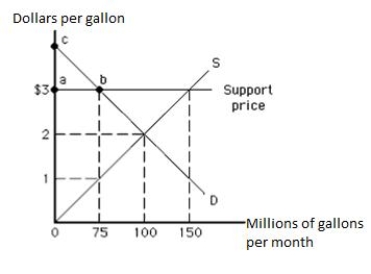
The following graph shows the market for milk. Suppose the government introduces a variety of policies that set floor prices for milk at $3. Without government intervention, the market price of milk would average $2 per gallon for a market quantity of 100 million gallons per month. In the graph below, triangle abc represents the consumer surplus at the support price.
Figure 16.1
Correct Answer:

Verified
Correct Answer:
Verified
Q30: Special-interest groups have little incentive to _<br>A)earn
Q33: Special-interest legislation generally leads to an increase
Q41: Rent-seeking activities by special interest groups result
Q42: Which of the following is an example
Q44: Which of the following federal budget allocations
Q49: Officials have estimated the size of the
Q71: Rent seeking is a zero-sum game because
Q174: A golf course or a swimming pool
Q185: Rent-seeking behavior imposes no costs on society.
Q190: When the support price for a good