True/False
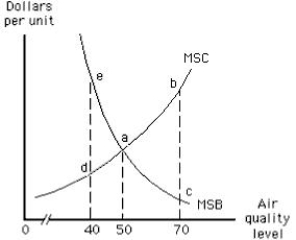
The following graph shows market equilibrium in the presence of an externality. The optimal air quality level is 50.
Figure 17.3
Correct Answer:

Verified
Correct Answer:
Verified
Related Questions
Q2: The marginal social benefit curve is downward
Q36: Government allocation of pollution rights cannot be
Q36: The Coase solution to the problem of
Q68: Environmental problems result when social costs and
Q73: In Japan, recycling is prevalent and landfill
Q74: Which of the following provides a positive
Q77: Byproducts of production or consumption that impose
Q137: Smokers and loud talkers help in generating
Q164: An externality is _<br>A)a cost of a
Q187: Markets for pollution rights _<br>A)assign property rights