Multiple Choice
The following graph shows the market for pollution rights in an economy. The optimal level of air quality is ______.
Figure 17.3
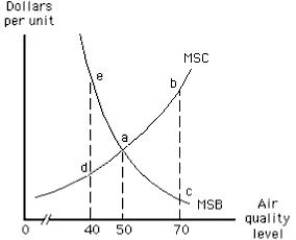
A) 0
B) 40
C) 50
D) 70
E) greater than 70
Correct Answer:

Verified
Correct Answer:
Verified
Related Questions
Q62: A negative externality is likely to arise
Q90: To solve the common-pool problem in fishing,
Q92: Which of the following is an example
Q94: Fishing, lumbering, tourism, and city buildings in
Q97: The Superfund law was designed to clean
Q98: Which of the following creates a positive
Q144: If the marginal social cost of producing
Q163: Oil is an example of a renewable
Q168: Suppose a city builds a new park
Q186: Private property rights are easily assigned to