Multiple Choice
The following graph shows the market for pollution rights. Which of the following could not have caused an increase in the demand for pollution rights?
Figure 17.4
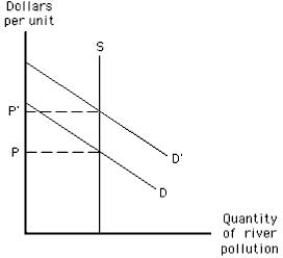
A) An increase in the number of polluting firms
B) An increase in the ability of the firm to absorb pollutants
C) A decrease in the cost of pollution abatement equipment
D) The ability of existing firms to sell pollution rights at a price lower than the market price.
E) The subsidy provided by the government on the price of pollution rights
Correct Answer:

Verified
Correct Answer:
Verified
Q33: Education confers positive externalities because _<br>A)some education
Q52: When a system of pollution rights is
Q53: An increase in the marginal cost of
Q117: Negative externalities of open resources arise because
Q119: When society receives more benefits from a
Q120: To maximize social welfare in the presence
Q122: Pollution arises because:<br>A)the atmosphere is a nonrenewable
Q126: A major source of water pollution in
Q176: In order to increase society's well-being,a production
Q178: According to the Coase theorem,_<br>A)government regulation is