Multiple Choice
The following graph shows the optimal allocation of pollution rights to firms polluting a river. If the government sells the right to pollute a river, _____.
Figure 17.5
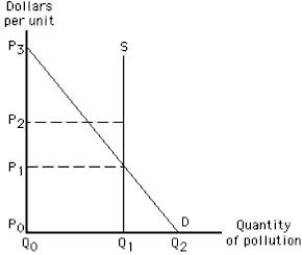
A) firms will emit Q1 units of the pollutant at a price of P0 each
B) firms will emit Q2 units of the pollutant at a price of P0 each
C) firms will emit Q0 units of the pollutant at a price of P3 each
D) firms will emit Q1 units of the pollutant at a price of P1 each
E) firms will emit Q2 units of the pollutant at a price of P3 each
Correct Answer:

Verified
Correct Answer:
Verified
Q38: If education creates positive externalities, then:<br>A)private markets
Q42: In order to increase a society's total
Q45: If consuming a good creates a positive
Q46: Which of the following is not used
Q55: Open-access resources tend to be _<br>A)conserved.<br>B)taxed.<br>C)overused.<br>D)efficiently used.<br>E)underutilized.
Q59: The common-pool problem arises _<br>A)when goods are
Q113: The main objective of the Comprehensive Environmental
Q134: Markets tend to underproduce goods that generate
Q135: To achieve the socially optimal level of
Q167: The Coase solution to the externality problem