Multiple Choice
The following graph shows the demand, the supply, and the marginal social benefit curves. An unregulated market would produce ______.
Figure 17.6
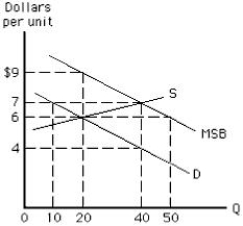
A) 0 units
B) 10 units
C) 20 units
D) 40 units
E) 50 units
Correct Answer:

Verified
Correct Answer:
Verified
Related Questions
Q2: The marginal social benefit curve is downward
Q36: The Coase solution to the problem of
Q68: Environmental problems result when social costs and
Q73: Coase argued that the free market should
Q76: The United States recycles a greater portion
Q87: The following graph shows market equilibrium in
Q88: A metal stamping factory moves next to
Q94: In the absence of government intervention, the
Q111: If the benefits to society of students
Q142: Markets fail when externalities are present _<br>A)because