Essay
The graph below shows the O2-binding curves for myoglobin (Mb)and hemoglobin (Hb).
a.Label the two curves (indicate which one represents Mb and which one represents Hb). 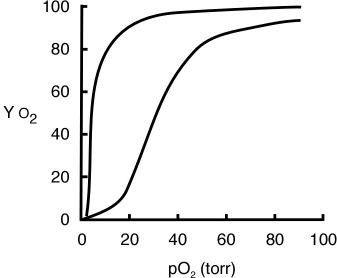
b.Use the graph to determine the Kd of myoglobin for O2 (show your approach).
c.What is the difference between myoglobin and hemoglobin that cause the O2-binding curves to so be different?
d.Why is it important that hemoglobin has these particular O2-binding characteristics?
Correct Answer:

Verified
a.See graph. 
b.Kd equals 3-4 torr (see ...View Answer
Unlock this answer now
Get Access to more Verified Answers free of charge
Correct Answer:
Verified
b.Kd equals 3-4 torr (see ...
View Answer
Unlock this answer now
Get Access to more Verified Answers free of charge
Q54: How many antigen-binding sites are present on
Q55: Humoral immunity is mediated by soluble molecules.Which
Q56: Which statement about antigen-binding sites in antibodies
Q57: What is the primary physiological function of
Q58: The Bohr effect refers to<br>A)the decrease in
Q60: Max Perutz's investigation of the structure of
Q61: Matching<br><br>-When unstable hemoglobin is degraded;degradation products often
Q62: The primary structure of mammalian hemoglobin,an
Q63: Matching<br><br>-An increase in pCO<sub>2</sub> causes hemoglobin's affinity
Q64: How many antigen-binding sites are present on