Multiple Choice
Which of the following graphs illustrates the behavior of a total variable cost? 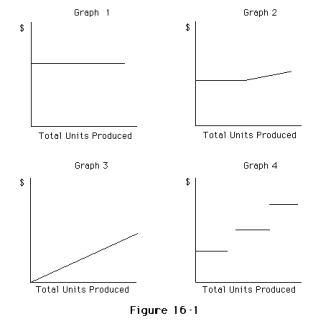
A) Graph 2
B) Graph 3
C) Graph 4
D) Graph 1
Correct Answer:

Verified
Correct Answer:
Verified
Related Questions
Q51: Clinton Co.has an operating leverage of 4.Sales
Q116: Kennedy Co.sells two products,Arks and Bins.Last year,Kennedy
Q118: Given the following cost and activity observations
Q119: The systematic examination of the relationships among
Q120: If fixed costs are $350,000,the unit selling
Q123: If fixed costs are $810,000,the unit selling
Q124: If fixed costs are $810,000,the unit selling
Q125: If sales total $1,000,000,fixed costs total $400,000,and
Q126: Snower Corporation sells product G for $150
Q214: The point where the sales line and