Multiple Choice
Which of the following graphs illustrates the nature of a mixed cost? 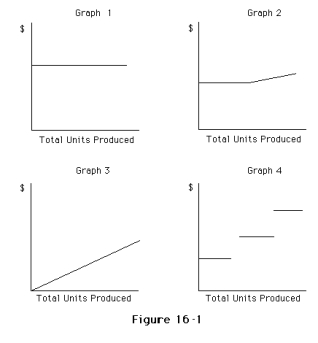
A) Graph 2
B) Graph 3
C) Graph 4
D) Graph 1
Correct Answer:

Verified
Correct Answer:
Verified
Related Questions
Q36: Which of the following is an example
Q109: Kennedy Co.sells two products,Arks and Bins.Last year,Kennedy
Q110: Which of the following describes the behavior
Q112: The following is a list of various
Q113: Cost-volume-profit analysis CANNOT be used if which
Q115: Which of the following graphs illustrates the
Q116: Kennedy Co.sells two products,Arks and Bins.Last year,Kennedy
Q118: Given the following cost and activity observations
Q119: The systematic examination of the relationships among
Q214: The point where the sales line and