Multiple Choice
Mussa Corporation reports the following data: 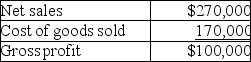 In vertical analysis,the cost of goods sold percentage is closest to: (Round your final answer to the nearest whole percentage)
A) 37%.
B) 59%.
C) 63%.
D) 170%.
Correct Answer:

Verified
Correct Answer:
Verified
Q8: Accounting data should paint a picture of
Q9: How is the leverage ratio calculated?<br>A)total debt
Q10: A thorough analysis of a company begins
Q11: If a company has sales of $150
Q12: The primary focus of horizontal analysis is:<br>A)percentage
Q14: Operating earnings should NOT be separated from
Q15: A knowledgeable investor tries to assess:<br>A)earnings quality.<br>B)accounts
Q16: The formula for the percentage change in
Q17: Dynasty Incorporated has the following data available
Q18: A vertical analysis is primarily concerned with:<br>A)the