Multiple Choice
State the type of graphical display for Graph A and Graph B. 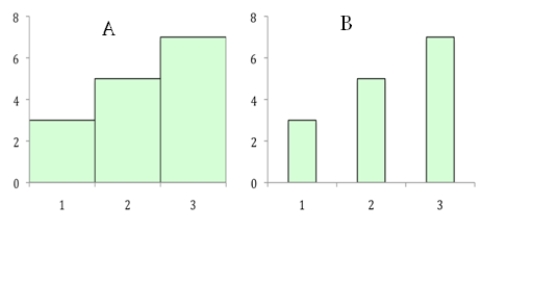
A) A is a bar chart;B is a histogram.
B) B is a bar chart;A is a histogram.
C) Both graphs are bar charts.
D) Both graphs are histograms.
Correct Answer:

Verified
Correct Answer:
Verified
Related Questions
Q2: The data should be grouped for the
Q12: The _ is the percentage of scores
Q14: When cumulating frequencies from the bottom up,the
Q15: A histogram is basically a bar chart
Q18: A researcher measures the time (in seconds)that
Q20: A percentile point is<br>A)the value of a
Q21: State the original data displayed in the
Q23: As a general rule,a simple frequency distribution
Q54: Whether you cumulate a frequency distribution from
Q62: A relative frequency is typically used with