Multiple Choice
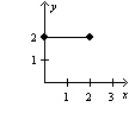
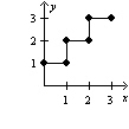
Given the following graphs, which graph represents fixed costs? 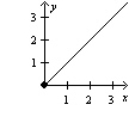

A) I
B) II
C) III
D) none of these
Correct Answer:

Verified
Correct Answer:
Verified
Related Questions
Q1: Which of the following statements is TRUE
Q69: A _ interval provides a range of
Q78: The costs incurred for the acquisition of
Q93: The hypothesis test of cost parameters indicates
Q98: A managerial accountant has determined the following
Q105: Figure 3-9 Hereford Company is planning to
Q170: The efficient level of activity performance is
Q176: The percentage of variability in the dependent
Q177: A nursing home requires one nurse for
Q182: When Multiple regression is used, the user