Multiple Choice
Infographic 6.1.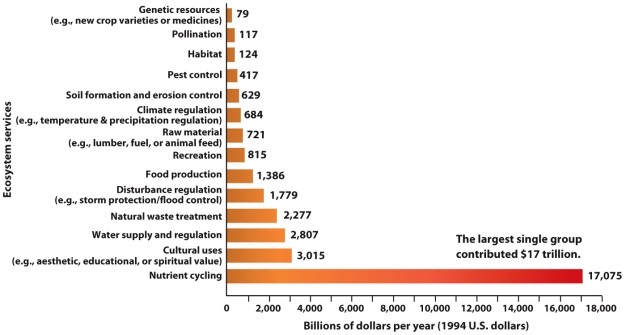
-Refer to Infographic 6.1. What does the figure show?
A) the cost to restore a degraded ecosystem for particular ecosystem services
B) the price of maintaining ecosystems such that they can continue to provide specific ecosystem services without degrading the environment
C) the monetary value ascribed to particular ecosystem services
D) the ecological footprint value of specific ecosystem services
E) the cost differential between natural capital and natural interest
Correct Answer:

Verified
Correct Answer:
Verified
Q4: What are assumptions of mainstream economics that
Q18: Which of the following would be part
Q20: A computer company leases rather than sells
Q22: Infographic 6.1.<br><img src="https://d2lvgg3v3hfg70.cloudfront.net/TB4358/.jpg" alt="Infographic 6.1.
Q24: By ignoring the _, economies create a
Q24: Mainstream economics makes the inaccurate assumption that
Q27: A product system in which the product
Q29: Infographic 6.1.<br><img src="https://d2lvgg3v3hfg70.cloudfront.net/TB4358/.jpg" alt="Infographic 6.1.
Q43: The company you are currently working for
Q64: Of the next billion people added to