Essay
Infographic 7.1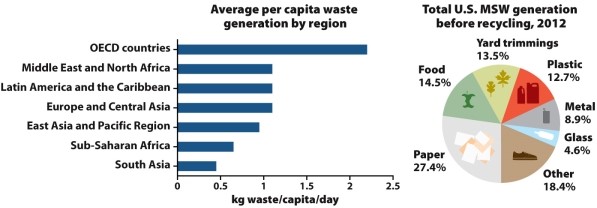
-Refer to Infographic 7.1. The pie chart shows components of U.S. municipal solid waste. For each component, describe what can be done to avoid disposal at a sanitary landfill.
Correct Answer:

Verified
Paper products, plastics, metals, and gl...View Answer
Unlock this answer now
Get Access to more Verified Answers free of charge
Correct Answer:
Verified
View Answer
Unlock this answer now
Get Access to more Verified Answers free of charge
Q4: What is the MOST appropriate way to
Q5: Which of the following is NOT a
Q6: At the grocery store,you are faced with
Q8: Infographic 7.8.<br><img src="https://d2lvgg3v3hfg70.cloudfront.net/TB4358/.jpg" alt="Infographic 7.8.
Q10: Everyday garbage or trash (solid waste)produced by
Q12: Hazardous waste not only affects humans but
Q20: Choosing to buy goods with minimal packaging
Q50: Which of the following waste and waste
Q69: Hazardous waste is _.<br>A)any material that humans
Q75: Why is there no such thing as