Essay
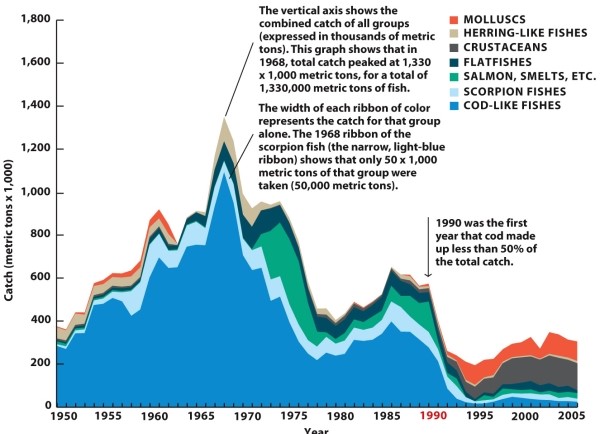
-Refer to Infographic 31.4. The figure shows fish catches in the Newfoundland-Labrador Shelf area of the North Atlantic. Describe the shift in the species and amounts taken in 1968, 1990, and 2005.
Correct Answer:

Verified
In 1968 the combined catch of all groups...View Answer
Unlock this answer now
Get Access to more Verified Answers free of charge
Correct Answer:
Verified
View Answer
Unlock this answer now
Get Access to more Verified Answers free of charge
Q3: What is likely to be the MOST
Q4: Explain the difference between a marine-protected area
Q7: More than half of the world's fisheries
Q8: Infographic 31.1. <br><img src="https://d2lvgg3v3hfg70.cloudfront.net/TB4358/.jpg" alt="Infographic 31.1.
Q14: Fisheries management is based on many decades
Q17: The difference between a marine-protected area and
Q29: What role do fish play in human
Q38: Compare and contrast fishing and open-water aquaculture.Discuss
Q39: What is the tragedy of the commons?
Q54: Which statement about fish is FALSE?<br>A)In poorer