Multiple Choice
The graph shows the changing electrical charge of a neuron when it activates. Pick the alternative that correctly labels the different phases depicted in the graph. 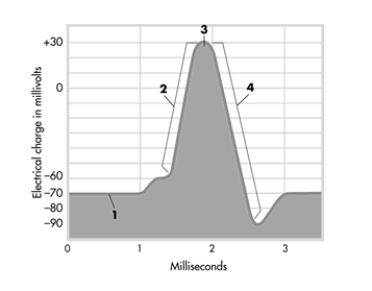
A) 1 = action potential, 2 = stimulus threshold, 3 = refractory period, 4 = resting potential
B) 1 = ions cross membrane, 2 = action potential, 3 = stimulus threshold, 4 = depolarization
C) 1 = depolarization, 2 = action potential, 3 = stimulus threshold, 4 = repolarization
D) 1 = resting potential, 2 = ions cross membrane, 3 = action potential, 4 = refractory period
Correct Answer:

Verified
Correct Answer:
Verified
Q34: Launched in 2009 by the National Institutes
Q35: Stress, exercise, and environmental complexity have been
Q36: An agonist is a drug or other
Q37: The three basic types of neurons are:<br>A)glial
Q38: Which of the following statements about glial
Q40: Which of the following statements is FALSE?<br>A)Sensory
Q41: Surrounding and protecting the brain and the
Q42: The nodes of Ranvier are:<br>A)a type of
Q43: The primary communication link between the left
Q44: Standing at an arrival gate, you scan