Multiple Choice
refer to the artwork below.
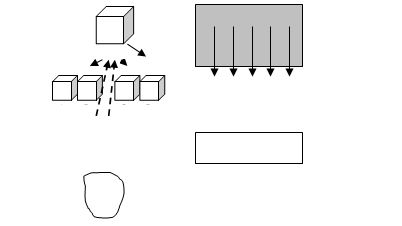
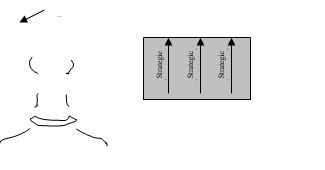
-In the drawing on the right, the unshaded rectangle in the middle is best described as
A) a graphic representation of the pressures decision makers face.
B) the zone of indifference.
C) the zone of feasibility.
D) type III decisions, which combine a top-down and bottom-up decisions.
E) systems analysis.
Correct Answer:

Verified
Correct Answer:
Verified
Q21: refer to the following two tables.<br>
Q22: refer to the following two tables.<br>
Q23: Explain how the nominal group technique (NGT)
Q24: How does cost-effectiveness analysis differ from cost-benefit
Q25: refer to the artwork below.<br> <img src="https://d2lvgg3v3hfg70.cloudfront.net/TB5947/.jpg"
Q27: The value of what a resource could
Q28: Explain how the following pair of concepts
Q29: What are the four steps in program
Q30: Compare and contrast systems analysis to operations
Q31: A ticket sold at a football stadium