Multiple Choice
Figure 12.1 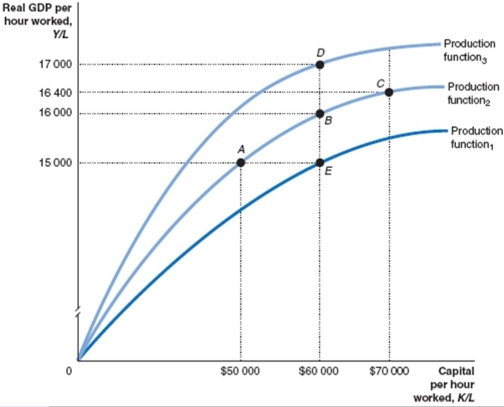
-The movement from A to E in Figure 12.1 illustrates
A) negative technological change.
B) a decline in capital per worker.
C) zero returns to capital.
D) diminishing returns to labour.
Correct Answer:

Verified
Correct Answer:
Verified
Related Questions
Q18: The 'rule of 70' states that it
Q22: Which of the following is not one
Q34: Explain why the increase in GDP per
Q38: If a country passes a labour law
Q48: When measuring real GDP, what does the
Q60: Describe how the final value of an
Q62: The measure of production that values output
Q104: How are 'intermediate goods' treated in the
Q171: Suppose that real GDP for 2012 was
Q255: Suggest two policies the government could pursue