Multiple Choice
Figure 7-5 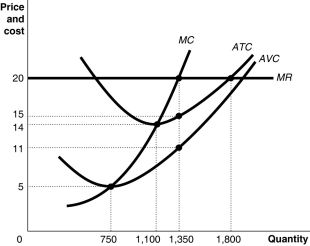 Figure 7-5 shows cost and demand curves facing a typical firm in a constant-cost, perfectly competitive industry.
-Refer to Figure 7-5.What is the amount of the firm's fixed cost of production?
A) $5400
B) $6750
C) $8100
D) It cannot be determined.
Correct Answer:

Verified
Correct Answer:
Verified
Q25: Which of the following is not a
Q61: A perfectly competitive wheat farmer in a
Q93: Figure 7.5 <img src="https://d2lvgg3v3hfg70.cloudfront.net/TB6606/.jpg" alt="Figure 7.5
Q96: In perfect competition<br>A) the market demand curve
Q112: If, for the last unit of a
Q129: A firm will break even when<br>A)P =
Q145: Both individual buyers and sellers in perfect
Q146: A perfectly competitive market is in long-run
Q153: Figure 7-7 <img src="https://d2lvgg3v3hfg70.cloudfront.net/TB4180/.jpg" alt="Figure 7-7
Q156: In long-run competitive equilibrium, the perfectly competitive