Multiple Choice
Figure 7-5 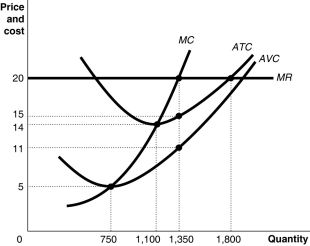 Figure 7-5 shows cost and demand curves facing a typical firm in a constant-cost, perfectly competitive industry.
-Refer to Figure 7-5.If the firm's fixed cost increases by $1000 due to a new environmental regulation,what happens in the diagram above?
A) All the cost curves shift upward.
B) Only the average variable cost and average total cost curves shift upward; marginal cost is not affected.
C) Only the average total cost curve shifts upward; the marginal cost and average variable cost curves are not affected.
D) None of the curves shift; only the fixed cost curve, which is not shown here, is affected.
Correct Answer:

Verified
Correct Answer:
Verified
Q43: In the short run, a firm that
Q46: A teenaged babysitter is similar to a
Q108: What is meant by allocative efficiency? How
Q135: If price is equal to average variable
Q170: What is productive efficiency?<br>A) A situation in
Q177: Assuming a market price of $4,fill in
Q205: If a perfectly competitive firm's price is
Q251: In the long run, a firm in
Q261: Which of the following describes the difference
Q296: If a perfectly competitive firm raises the