Multiple Choice
Figure 7-7 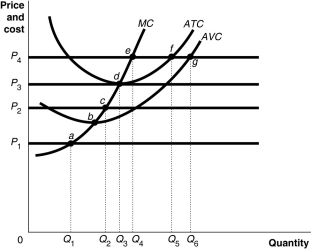 Figure 7-7 shows cost and demand curves facing a profit-maximising, perfectly competitive firm.
-Refer to Figure 7-7.At price P3,the firm would produce
A) Q2 units.
B) Q3 units.
C) Q4 units.
D) Q5 units.
Correct Answer:

Verified
Correct Answer:
Verified
Q39: Firms that are price takers<br>A)must lower their
Q40: Figure 7.4 <img src="https://d2lvgg3v3hfg70.cloudfront.net/TB6606/.jpg" alt="Figure 7.4
Q47: Figure 7-3 <img src="https://d2lvgg3v3hfg70.cloudfront.net/TB4180/.jpg" alt="Figure 7-3
Q49: Apple introduced its iPhone 3G in July
Q91: Assume that price is greater than average
Q130: If in the long run a firm
Q134: Perfect competition is characterised by all of
Q181: What is the relationship among the following
Q184: The minimum point on the average variable
Q189: Figure 7.1 <img src="https://d2lvgg3v3hfg70.cloudfront.net/TB6606/.jpg" alt="Figure 7.1