Multiple Choice
Figure 7.10 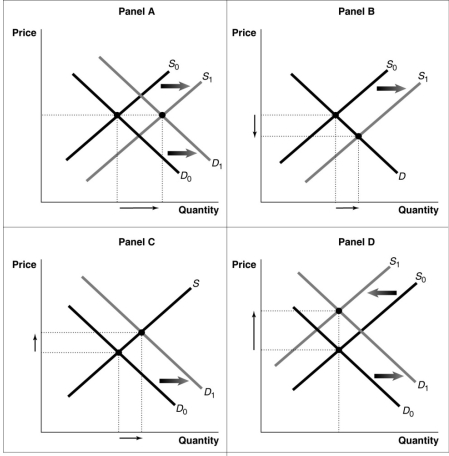
-Refer to Figure 7.10.Consider a typical firm in a perfectly competitive industry that makes short-run profits.Which of the diagrams in the figure shows the effect on the industry as it transitions to a long-run equilibrium?
A) Panel A
B) Panel B
C) Panel C
D) Panel D
Correct Answer:

Verified
Correct Answer:
Verified
Q45: If a firm's fixed cost exceeds its
Q47: Jason, a high-school student, mows lawns for
Q74: Letters are used to represent the terms
Q114: Figure 7.7 <img src="https://d2lvgg3v3hfg70.cloudfront.net/TB6606/.jpg" alt="Figure 7.7
Q119: Figure 7.7 <img src="https://d2lvgg3v3hfg70.cloudfront.net/TB6606/.jpg" alt="Figure 7.7
Q147: In the short run, a firm that
Q149: Why is the demand curve for each
Q210: In early 2007, Pioneer and JVC, two
Q230: In analysing the decision to shut down
Q263: A perfectly competitive apple farm produces 1000