Multiple Choice
Figure 7.12 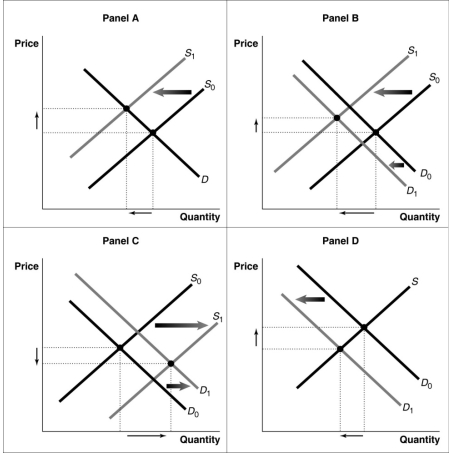
-Refer to Figure 7.12.Consider a typical firm in a perfectly competitive industry which is incurring short-run losses.Which of the diagrams in the figure shows the effect on the industry as it transitions to a long-run equilibrium?
A) Panel A
B) Panel B
C) Panel C
D) Panel D
Correct Answer:

Verified
Correct Answer:
Verified
Q25: Suppose Veronica sells teapots in the
Q26: If the long-run average cost curve is
Q27: Which of the following is the best
Q28: Figure 7.7 <img src="https://d2lvgg3v3hfg70.cloudfront.net/TB6606/.jpg" alt="Figure 7.7
Q91: Assume that price is greater than average
Q139: What is the minimum point on the
Q153: If, for a given output level, a
Q180: Apple introduced its iPhone 3G in July
Q188: In the long run, perfectly competitive firms
Q244: Figure 8.15 <img src="https://d2lvgg3v3hfg70.cloudfront.net/TB1015/.jpg" alt="Figure 8.15