Essay
Figure 7-15 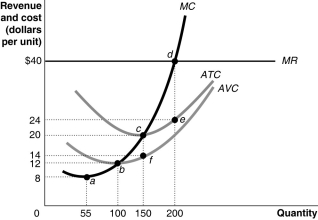
-Use Figure 7-15 to answer the following questions.
a.How can you determine that the figure represents a graph of a perfectly competitive firm? Be specific; indicate which curve gives you the information and how you use this information to arrive at your conclusion.
b.What is the market price?
c.What is the profit-maximising output?
d.What is total revenue at the profit-maximising output?
e.What is the total cost at the profit-maximising output?
f.What is the profit or loss at the profit-maximising output?
g.What is the firm's total fixed cost?
h.What is the total variable cost?
i.Identify the firm's short-run supply curve.
j.Is the industry in a long-run equilibrium?
k.If it is not in long-run equilibrium,what will happen in this industry to restore long-run equilibrium?
l.In long-run equilibrium,what is the firm's profit maximising quantity?
Correct Answer:

Verified
a.The perfectly competitive firm is a pr...View Answer
Unlock this answer now
Get Access to more Verified Answers free of charge
Correct Answer:
Verified
View Answer
Unlock this answer now
Get Access to more Verified Answers free of charge
Q41: If a firm shuts down in the
Q52: In the short run, a profit-maximising firm
Q118: Figure 7.10 <img src="https://d2lvgg3v3hfg70.cloudfront.net/TB6606/.jpg" alt="Figure 7.10
Q135: If a typical firm in a perfectly
Q154: Perfectly competitive industries tend to produce low-priced,
Q226: Figure 7-9 <img src="https://d2lvgg3v3hfg70.cloudfront.net/TB4180/.jpg" alt="Figure 7-9
Q226: Which of the following describes a difference
Q233: Figure 7-7 <img src="https://d2lvgg3v3hfg70.cloudfront.net/TB4180/.jpg" alt="Figure 7-7
Q282: Firms in perfect competition produce the allocatively
Q285: Profit is the difference between<br>A)marginal revenue and