Multiple Choice
Figure 3-8 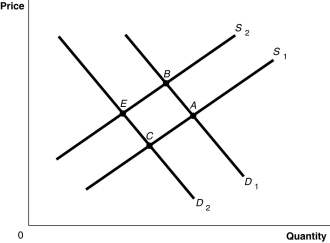
-Refer to Figure 3-8.The graph in this figure illustrates an initial competitive equilibrium in the market for apples at the intersection of D2 and S2 (point E) Which of the following changes would cause the equilibrium to change to point A?
A) A positive change in the technology used to produce apples and a decrease in the price of oranges, a substitute for apples.
B) An increase in the wages of apple workers and a decrease in the price of oranges, a substitute for apples.
C) An increase in the number of apple producers and a decrease in the number of apple trees as a result of disease.
D) A decrease in the wages of apple workers and an increase in the price of oranges, a substitute for apples.
Correct Answer:

Verified
Correct Answer:
Verified
Q45: If the price of music downloads were
Q46: Figure 3-2 <img src="https://d2lvgg3v3hfg70.cloudfront.net/TB3018/.jpg" alt="Figure 3-2
Q69: Assume that the demand curve for MP3
Q73: An increase in the quantity of a
Q81: Which of the following would cause a
Q88: A(n)_ is represented by a leftward shift
Q94: A supply schedule<br>A) is a table that
Q113: Technological advancements have led to lower prices
Q130: If more insurance companies decide to cover
Q223: If the Apple iPhone and the Samsung