Multiple Choice
Figure 5-7 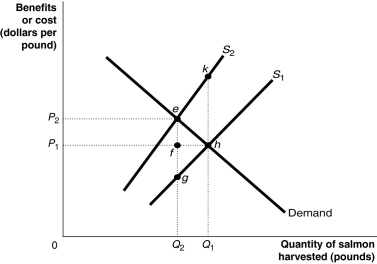
Figure 5-7 shows the market for Atlantic salmon, a common resource. The current market equilibrium output of Q1 is not the economically efficient output. The economically efficient output is Q2.
-Refer to Figure 5-7.Identify the area that shows the deadweight loss from overfishing.
A) egh
B) ekh
C) efh
D) eghk
Correct Answer:

Verified
Correct Answer:
Verified
Q48: Figure 5-6 <img src="https://d2lvgg3v3hfg70.cloudfront.net/TB4184/.jpg" alt="Figure 5-6
Q110: Figure 5-3<br> <img src="https://d2lvgg3v3hfg70.cloudfront.net/TB4193/.jpg" alt="Figure 5-3
Q129: Governments can increase the consumption of a
Q161: Which of the following is an example
Q170: For-profit producers will produce only private goods
Q187: Which of the following is an example
Q207: Private costs<br>A)are borne by producers of a
Q219: Sefronia and Bella share an apartment and
Q220: Which of the following must be present
Q262: A market supply curve reflects the<br>A)external costs