Multiple Choice
Figure 18-5 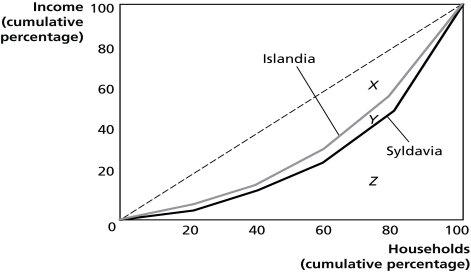
Figure 18-5 shows the Lorenz curves for Islandia and Syldavia.
-Refer to Figure 18-5.If area X = 2,060,area Y = 240,and area Z= 2,700,calculate the Gini coefficient for Syldavia.
A) 0.05
B) 0.12
C) 0.46
D) 0.85
Correct Answer:

Verified
Correct Answer:
Verified
Q18: Table 18-1<br> <img src="https://d2lvgg3v3hfg70.cloudfront.net/TB4193/.jpg" alt="Table 18-1
Q33: When the majority of voters have preferences
Q41: Table 18-1<br> <img src="https://d2lvgg3v3hfg70.cloudfront.net/TB4193/.jpg" alt="Table 18-1
Q111: Horizontal equity means that two people in
Q113: The corporate income tax is ultimately paid
Q146: The public choice model asserts that the
Q158: All of the following occur whenever a
Q219: Figure 18-1<br> <img src="https://d2lvgg3v3hfg70.cloudfront.net/TB4193/.jpg" alt="Figure 18-1
Q220: What are the two types of taxes
Q257: Figure 18-4<br> <img src="https://d2lvgg3v3hfg70.cloudfront.net/TB4193/.jpg" alt="Figure 18-4