Multiple Choice
Figure 13-3 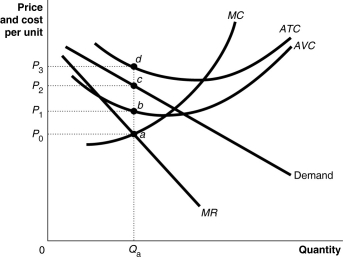
Figure 13-3 shows short-run cost and demand curves for a monopolistically competitive firm in the market for designer watches.
-Refer to Figure 13-3.What is the area that represents the loss made by the firm?
A) the area P0adP3
B) the area P1bcP2
C) the area P0acP2
D) the area P2cdP3
Correct Answer:

Verified
Correct Answer:
Verified
Q5: Figure 13-10 <img src="https://d2lvgg3v3hfg70.cloudfront.net/TB4184/.jpg" alt="Figure 13-10
Q10: Long-run equilibrium under monopolistic competition is similar
Q11: Figure 13-3 <img src="https://d2lvgg3v3hfg70.cloudfront.net/TB4184/.jpg" alt="Figure 13-3
Q13: Figure 13-3 <img src="https://d2lvgg3v3hfg70.cloudfront.net/TB4184/.jpg" alt="Figure 13-3
Q25: In monopolistic competition, if a firm produces
Q72: Which of the following statements is true
Q144: Draw a graph that shows the impact
Q211: In the short run, a profit-maximizing firm's
Q245: If a monopolistically competitive firm breaks even,
Q261: Table 13-1<br> <img src="https://d2lvgg3v3hfg70.cloudfront.net/TB4188/.jpg" alt="Table 13-1