Multiple Choice
Figure 13-6 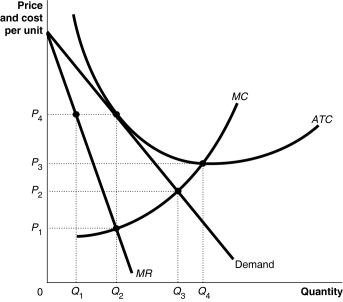
-Refer to Figure 13-6.What is the allocatively efficient output for the firm represented in the diagram?
A) Q1 units
B) Q2 units
C) Q3 units
D) Q4 units
Correct Answer:

Verified
Correct Answer:
Verified
Q11: Figure 13-3 <img src="https://d2lvgg3v3hfg70.cloudfront.net/TB4184/.jpg" alt="Figure 13-3
Q13: Figure 13-3 <img src="https://d2lvgg3v3hfg70.cloudfront.net/TB4184/.jpg" alt="Figure 13-3
Q42: In the long run, if price is
Q88: In the long run, what happens to
Q104: If buyers of a monopolistically competitive product
Q120: If the demand curve for a firm
Q167: The financial situation at Starbucks in the
Q209: For productive efficiency to hold<br>A)price must equal
Q245: If a monopolistically competitive firm breaks even,
Q261: Table 13-1<br> <img src="https://d2lvgg3v3hfg70.cloudfront.net/TB4188/.jpg" alt="Table 13-1