Multiple Choice
Figure 10-5 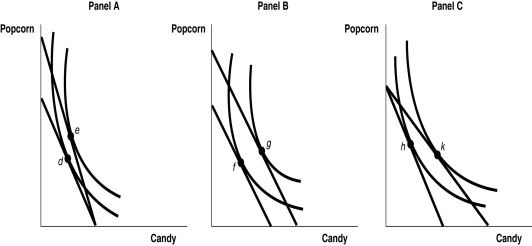
-Refer to Figure 10-5.Which diagram demonstrates an increase in total utility following a decrease in the price of popcorn?
A) the movement from d to e in Panel A
B) the movement from f to g in Panel B
C) the movement from h to k in Panel C
D) none of the above
Correct Answer:

Verified
Correct Answer:
Verified
Q26: Which of the following is a common
Q46: Arnold Kim began blogging about Apple products
Q47: What is behavioral economics?<br>A)the study of how
Q70: Research by Daniel Kahneman,Jack Knetch,and Richard Thaler
Q118: A common mistake made by consumers is
Q131: A fair number of people buy expensive
Q131: Adhira buys chocolates and almonds.She has 3
Q141: A construction project in Congressman Foghorn's district
Q184: What is an indifference curve?<br>A) It is
Q203: If, when you consume another piece of