Multiple Choice
Figure 6-12 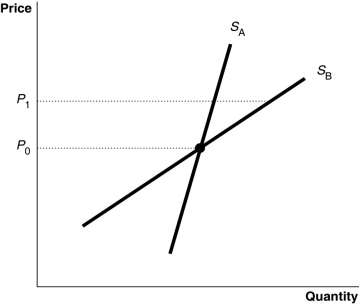
-Refer to Figure 6-12. The diagram shows two supply curves, SA and SB. As price rises from P0 to P1, which supply curve is more elastic?
A) SA
B) SB
C) They are equally inelastic.
D) They are equally elastic.
Correct Answer:

Verified
Correct Answer:
Verified
Q81: If the cross-price elasticity of demand for
Q111: When there few close substitutes available for
Q154: The market demand for The Federalist Papers
Q162: The cross-price elasticity of demand measures the<br>A)absolute
Q181: Figure 6-12 <img src="https://d2lvgg3v3hfg70.cloudfront.net/TB7397/.jpg" alt="Figure 6-12
Q209: The paradox of American farming is<br>A)the demand
Q225: Figure 6-5<br> <img src="https://d2lvgg3v3hfg70.cloudfront.net/TB4193/.jpg" alt="Figure 6-5
Q239: When the price of tortilla chips rose
Q242: Studies show that the income elasticity of
Q252: Table 6-4<br>The publisher of a magazine gives