Essay
The graph below represents the market for walnuts.Identify the values of the marginal benefit and the marginal cost at the output levels of 2,000 pounds,4,000 pounds and 6,000 pounds.At each of these output levels,state whether output is inefficiently high,inefficiently low,or economically efficient. 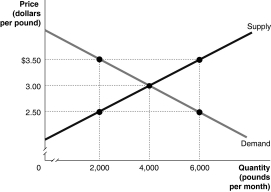
Correct Answer:

Verified
Output level = 2,000 lbs:: marginal bene...View Answer
Unlock this answer now
Get Access to more Verified Answers free of charge
Correct Answer:
Verified
View Answer
Unlock this answer now
Get Access to more Verified Answers free of charge
Q2: If equilibrium is achieved in a competitive
Q15: The total amount of producer surplus in
Q74: Figure 4-3<br> <img src="https://d2lvgg3v3hfg70.cloudfront.net/TB4193/.jpg" alt="Figure 4-3
Q108: Consumer surplus is the difference between the
Q116: A tax is efficient if it imposes
Q131: Marginal benefit is equal to the _
Q169: Consumers are willing to purchase a product
Q190: In New York City, about 1 million
Q192: If the quantity of donuts supplied is
Q215: Article Summary<br>In an attempt to discourage smoking,