Multiple Choice
Table 3-2
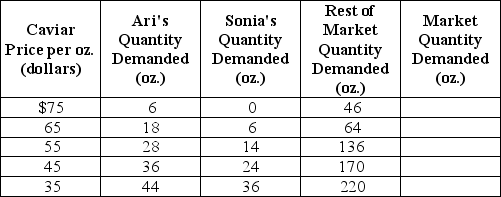
-Refer to Table 3-2.The table above shows the demand schedules for caviar of two individuals (Ari and Sonia) and the rest of the market.If the price of caviar falls from $45 to $35, the market quantity demanded would
A) decrease by 50 oz.
B) increase by 70 oz.
C) increase by 50 oz.
D) decrease by 70 oz.
Correct Answer:

Verified
Correct Answer:
Verified
Q117: The income effect of a price change
Q118: Assume that both the demand curve and
Q119: Figure 3-4<br> <img src="https://d2lvgg3v3hfg70.cloudfront.net/TB4193/.jpg" alt="Figure 3-4
Q120: Which of the following would definitely cause
Q121: Figure 3-5<br> <img src="https://d2lvgg3v3hfg70.cloudfront.net/TB4193/.jpg" alt="Figure 3-5
Q123: The _ effect refers to the change
Q124: Figure 3-6<br> <img src="https://d2lvgg3v3hfg70.cloudfront.net/TB4193/.jpg" alt="Figure 3-6
Q125: Select the phrase that correctly completes the
Q126: If an increase in income leads to
Q127: If a demand curve shifts to the