Multiple Choice
Figure 3-8 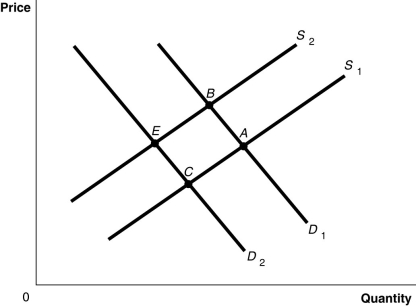
-Refer to Figure 3-8. The graph in this figure illustrates an initial competitive equilibrium in the market for sugar at the intersection of D1 and S2 (point B) . If there is an decrease in the price of fertilizer used on sugar cane and there is a decrease in tastes for sugar-sweetened soft drinks, how will the equilibrium point change?
A) The equilibrium point will move from B to A.
B) The equilibrium point will move from B to C.
C) There will be no change in the equilibrium point.
D) The equilibrium point will move from B to E.
Correct Answer:

Verified
Correct Answer:
Verified
Q40: Suppose a drought resulted in a major
Q57: A change in which variable will change
Q82: What is the difference between an "increase
Q85: A demand curve shows the relationship between<br>A)the
Q140: Figure 3-8 <img src="https://d2lvgg3v3hfg70.cloudfront.net/TB1236/.jpg" alt="Figure 3-8
Q168: Table 3-4<br> <img src="https://d2lvgg3v3hfg70.cloudfront.net/TB7397/.jpg" alt="Table 3-4
Q170: Use the following demand schedule for cherries
Q175: Figure 3-8 <img src="https://d2lvgg3v3hfg70.cloudfront.net/TB7397/.jpg" alt="Figure 3-8
Q177: Table 3-4<br> <img src="https://d2lvgg3v3hfg70.cloudfront.net/TB7397/.jpg" alt="Table 3-4
Q202: Figure 3-7 <img src="https://d2lvgg3v3hfg70.cloudfront.net/TB1236/.jpg" alt="Figure 3-7