Multiple Choice
Figure 3-8 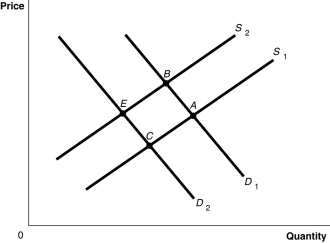
-Refer to Figure 3-8.The graph in this figure illustrates an initial competitive equilibrium in the market for apples at the intersection of D2 and S2 (point E) ) Which of the following changes would cause the equilibrium to change to point A?
A) A positive change in the technology used to produce apples and decrease in the price of oranges, a substitute for apples.
B) An increase in the wages of apple workers and a decrease in the price of oranges, a substitute for apples.
C) An increase in the number of apple producers and a decrease in the number of apple trees as a result of disease.
D) A decrease in the wages of apple workers and an increase in the price of oranges, a substitute for apples.
Correct Answer:

Verified
Correct Answer:
Verified
Q30: Indicate whether each of the following situations
Q57: A change in which variable will change
Q96: Figure 3-8 <img src="https://d2lvgg3v3hfg70.cloudfront.net/TB7397/.jpg" alt="Figure 3-8
Q119: Figure 3-4<br> <img src="https://d2lvgg3v3hfg70.cloudfront.net/TB4193/.jpg" alt="Figure 3-4
Q126: Elvira decreased her consumption of bananas when
Q129: Discuss the correct and incorrect economic analysis
Q132: If the United States placed an embargo
Q166: Nearly a quarter of China's 1.3 billion
Q194: Figure 3-2 <img src="https://d2lvgg3v3hfg70.cloudfront.net/TB7397/.jpg" alt="Figure 3-2
Q195: If consumers believe the price of iPads